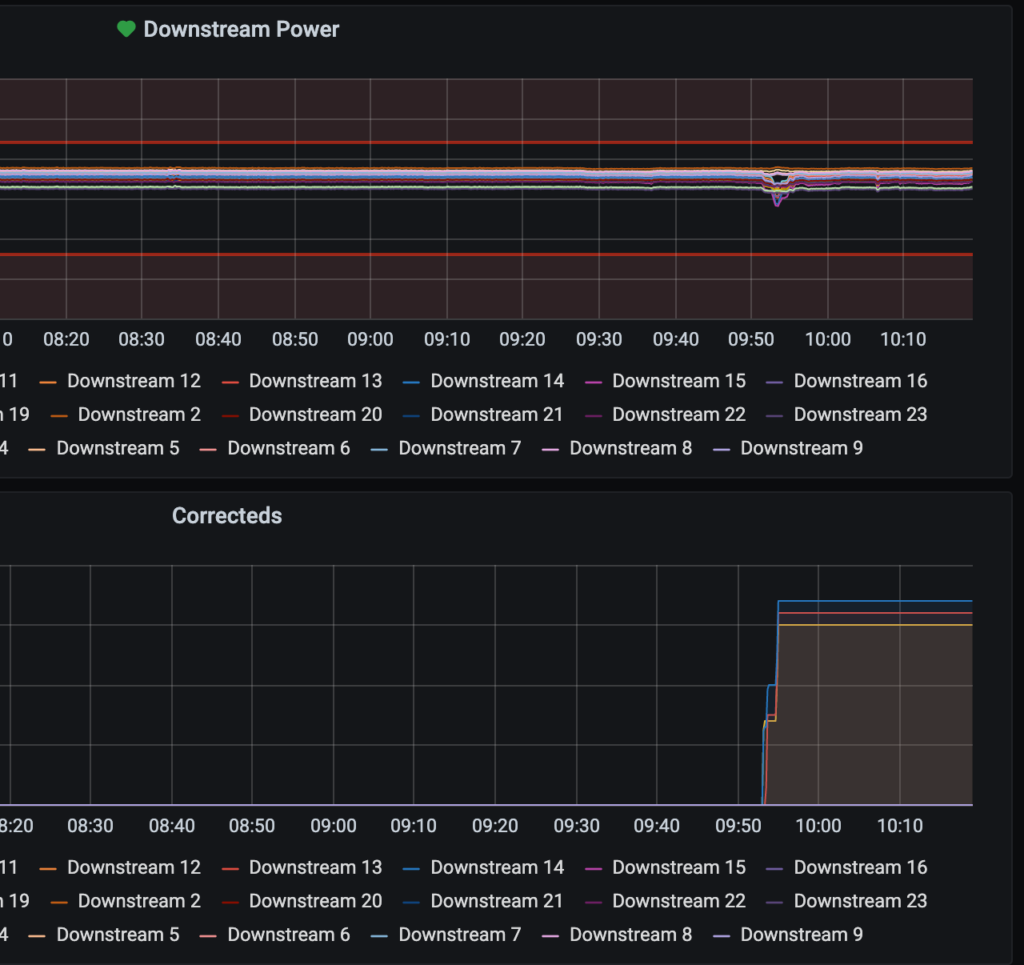
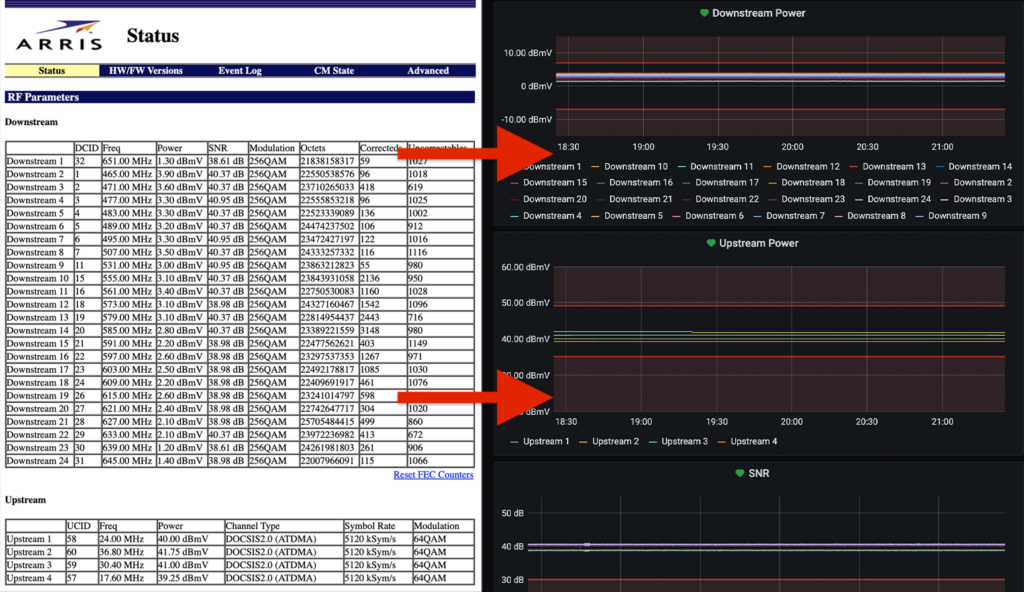
It felt good to complete this project that’s been on my list for quite some time. The main goal was to scrape the values from my modem’s status page and pipe them into InfluxDB, which feeds Grafana. Not only could I look at data trends, but I could receive alerts if certain values exceeded an acceptable threshold.
Overall this is a straightforward process:
- Pull in the HTML from the status page (which happens to not need any authentication, making it even easier)
- Parse the tables we care about (Downstream and Upstream) using XPaths
- Munge the data into something suitable for InfluxDB
- Insert the data into InfluxDB
- Query the InfluxDB data from Grafana
I knew I wanted to use Python for the project, so I first looked into Scrapy. After wrapping my mind around it (somewhat) I gave it a go and actually had a working solution… but it felt way over engineered and at times inflexible for what I wanted. I threw 90% of that solution away and went with a simpler script.
What I landed on was something that’s custom and lightweight, but extendable in case someone has a different status page or wants to use an alternative to InfluxDB.