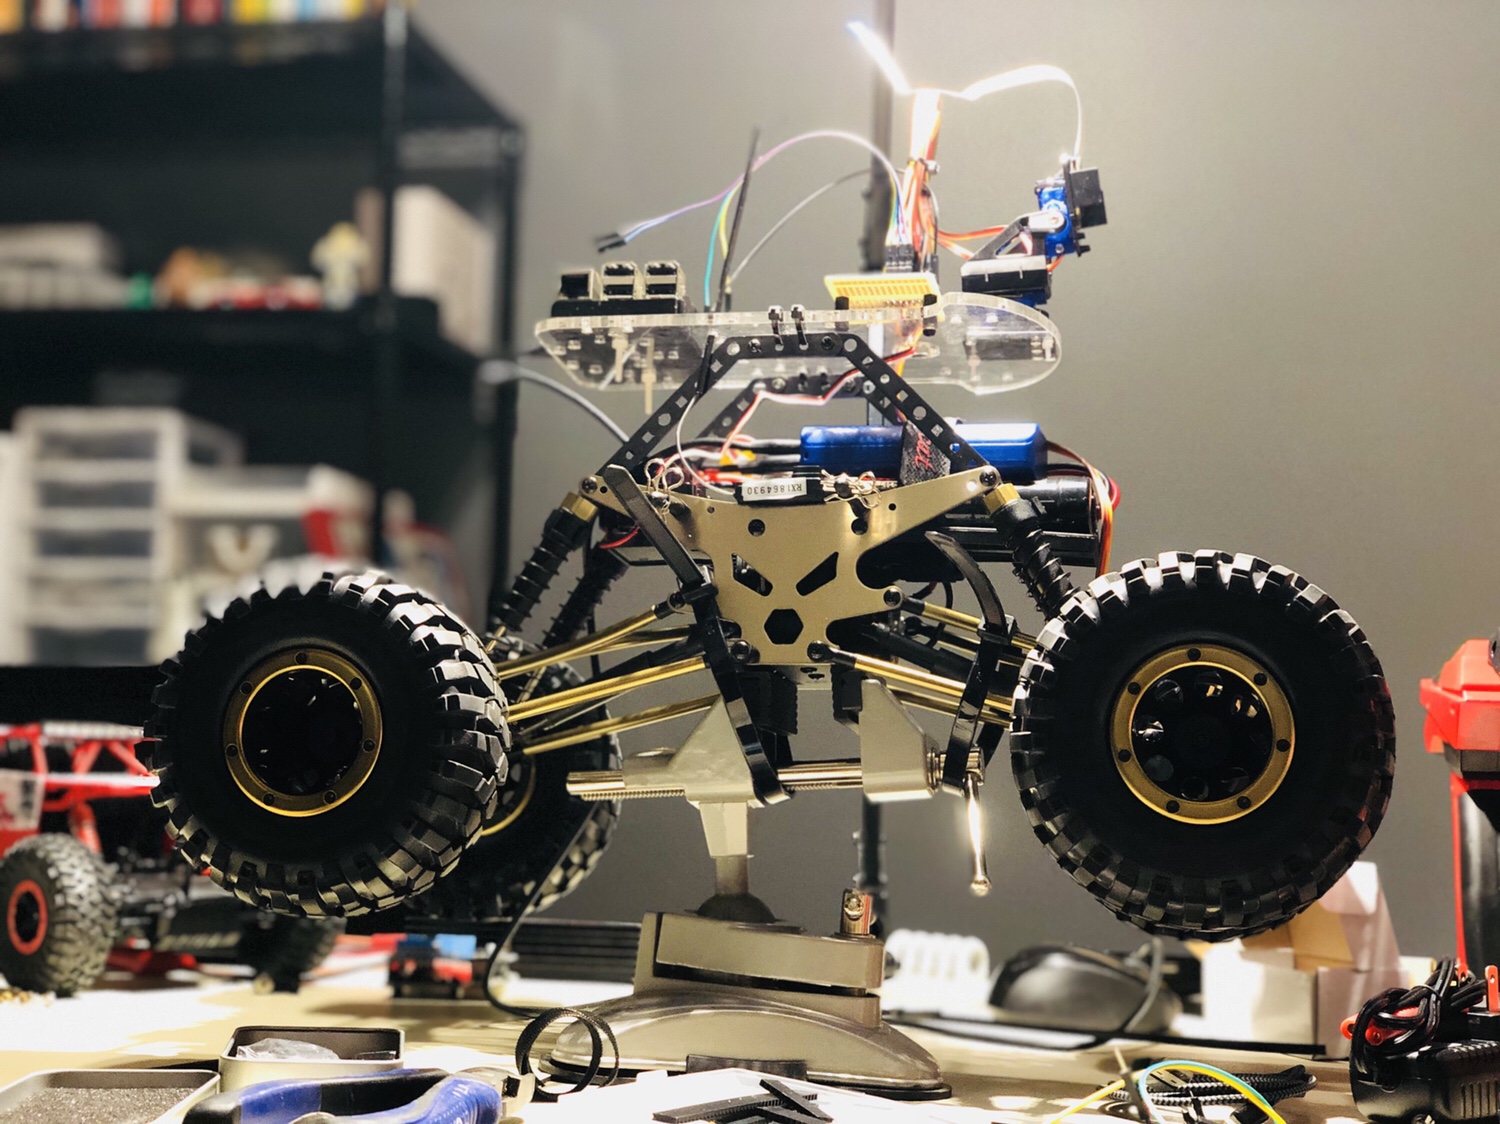
I had the privilege of talking to first graders at the local elementary school about coding and robots for STEM Day! This was extra special because one of them happens to be my kiddo. 😀 I used Dash robots (graciously provided by the engineering teacher) to demonstrate how we communicate with computers and instruct them – one command at a time – to accomplish tasks.
Dash drove around, played a Xylophone, drew on paper, played sounds, catapulted a ball, and more. Using the drag and drop programming interface of the Wonder app was a great tool for this age range, and I think they had as much fun as I did.
Back around the time the first iPhone was released (feeling old! 😬) I was taking a course where we built a CPU-based ray tracer in C.
If you’re not familiar with the ray tracing technique, check it out here.
What I mostly remember from the course was math, pointers, and segfaults. Oh the segfaults. By the end of the course, however, I had a decent grasp on C and that’s been a valuable skill so many times in my career and hobbies.
How the original project functioned
You wrote an input file that describes various shapes, light sources, and attributes of the environment.
You fed the file into the C program.
You waited a bit (remember, we’re doing everything on the CPU in ~2007).
You got a fancy PPM file. (PPM was a great image format due to its simplicity – we were dealing with enough!)
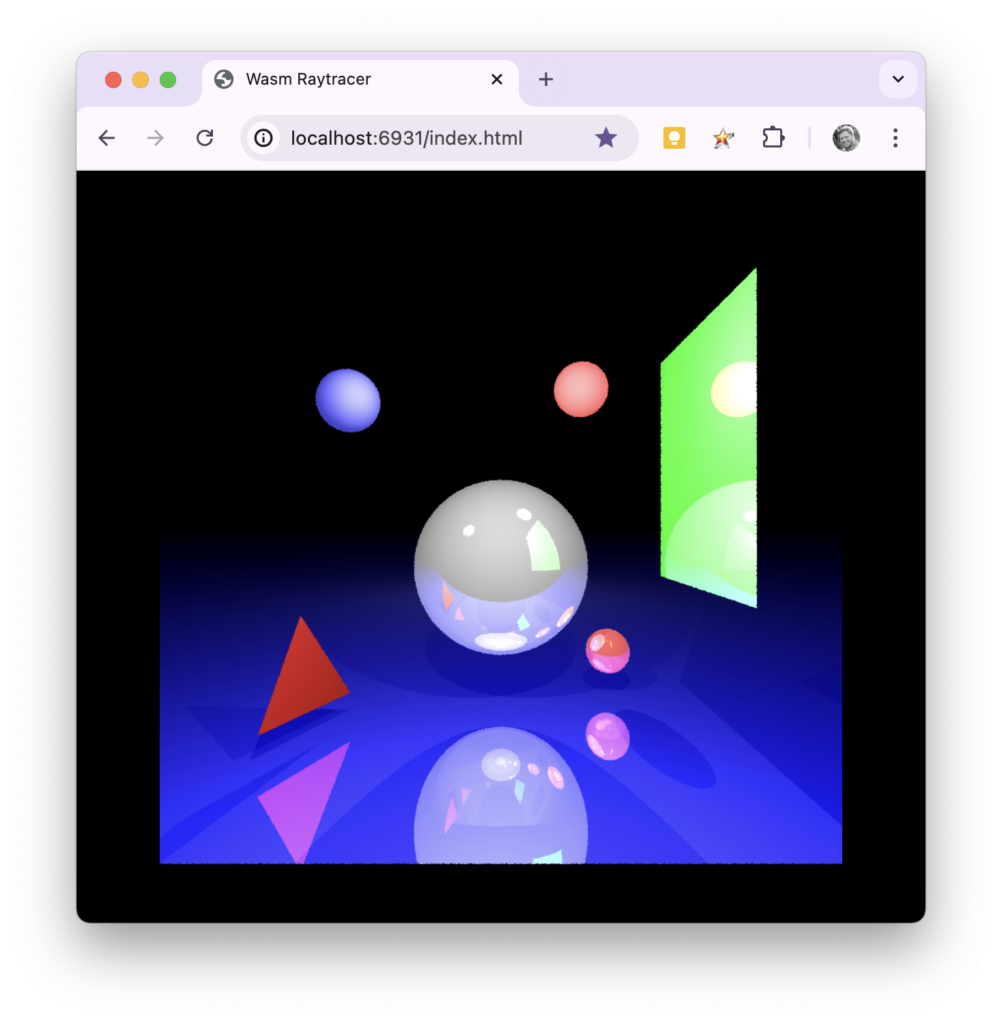
Wasm motivation
Recently I decided that I wanted to learn more about the inner workings of WebAssembly (Wasm) and figured this would be a great candidate project. It’s fully contained without any external dependencies, *I wrote all the code so it shouldn’t be too mysterious, and if I got it to work there would be a visual payoff.
*Feel free to judge some of the rough spots in the code – it was a long time ago!
Process
The first thing I made sure of was that I could compile the project locally the non-Wasm way. There were no hiccups there – it worked on the first try using the Makefile. ✅
I then started reading this tutorial on converting a C project to Wasm. After installing emscripten on macOS (I used Homebrew) I decided to add a new C source file to the project and added a function that looked something like:
#include "emscripten.h"

EMSCRIPTEN_KEEPALIVE
int version() {
  return 42;
}
If I could get this to work I could at least get information from C -> JS for starters. All that it took to make this work was:
Substituting gcc with emcc in the Makefile
Making sure I added the EXPORTED_RUNTIME_METHODS='["cwrap"]' compiler flag
Calling Module.cwrap from JS to use the function
That was pretty much it. I’m not going to go super in-depth with this blog post because I think most of it can be figured out from the source.
Next challenges
I had a bit more to go but was surprised at how easy it was to send a value from C to JS. The next items to figure out were:
The ray tracer expected an input file and an output file, how would this work with a browser?
We can pass integers easily, but what about the big array of pixel data when we ultimately generate an image?
Where would our C calls to fprintf and its siblings go when trying to debug to stdout and stderr?
What about main – does it run?
I’ll go ahead and spoil these really quickly in their respective order:
fmemopen saved the day by taking the input string (which is a char *) and providing a FILE type in return which is an in-memory buffer stream. In other words, no massive overhauling needed although we aren’t using “real” files anymore. In addition a slight refactoring was done to the project to return an array of pixels rather than write out an image file.
They automagically show up in the browser console! This is a really nice feature, and stderr calls are even properly displayed as errors.
Yes! In my case I got rid of it because it was prompting for the CLI input, but it was interesting to see that it automatically ran. There may be a compiler setting to disable this.
A summary of what it took to convert the ray tracer to Wasm
I first want to acknowledge that I did the thing that I try to never do: I showed off a snazzy project, left some hints here and there of how it worked, said I would follow up with full details… and never did. That’s lame.
I’ve had multiple people reach out for more info and I’m glad they did, since that’s pushed me to finally get some repos public and this belated follow-up written. Apologies!
To jump straight to it, I’ve published these two repos:
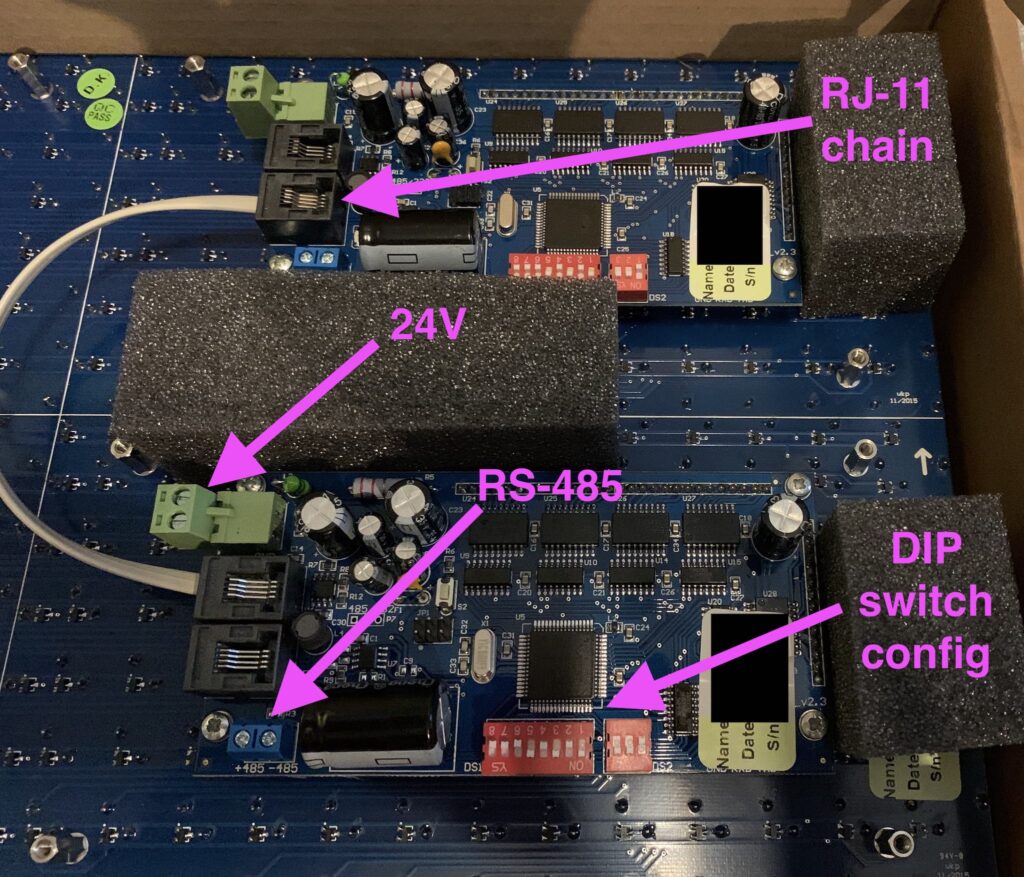
Let’s first go over the hardware involved. The most important piece, of course, is the Alfa-Zeta XY5.
In my case, the 14×28 board was made up of two 7×28 panels connected together via RJ-11.
The panels are pricey, but they can be thought of as “hardware easy-mode”. Alfa-Zeta has done the hard job building the controller that drives the hardware and all we have to do is supply power and an RS-485 signal that abides by their protocol.
If you purchase a panel from them there are two important documents to request:
The main manual that describes the specs, features, and things like the DIP switch settings.
The protocol for sending commands to the controllers (which is really simple).
These can easily found by searching around, but if you own a panel the company should supply them. Most of the protocol can be deduced by looking at open source code.
At the moment there isn’t much to it – you can either compile the firmware to run in a mode that writes data from UDP packets to the board, or you can draw “locally” using Adafruit GFX methods.
See the README in the repo above for more details.
Semi-interestingly I utilized Adafruit GFXagain, this time via swift-gfx-wrapper to draw to the board over UDP. It’s hacky and experimental, but that’s part of the fun.
See the README in the repo above for more details.
Since doomgeneric exposes the framebuffer, I throw that into an SKTexture and that gets added to a node in the SpriteKit scene, which is subclassed to override the update method to call doomgeneric_Tick(). Objective-C is used for interop between C and Swift, and fulfills most of the functions listed here. SwiftUI ultimately outputs the scene.
Very few tweaks needed to be made in doomgeneric itself.
They were basically:
Conditional compilation for a few calls that watchOS didn’t support (and we didn’t need).
Tweaking the 32-bit color bit offsets.
Handling a crash related to passing in arguments.
On watchOS we pass the absolute path of the WAD file in the main bundle to the engine.
Adjusting some SDL2 includes so headers could be found.
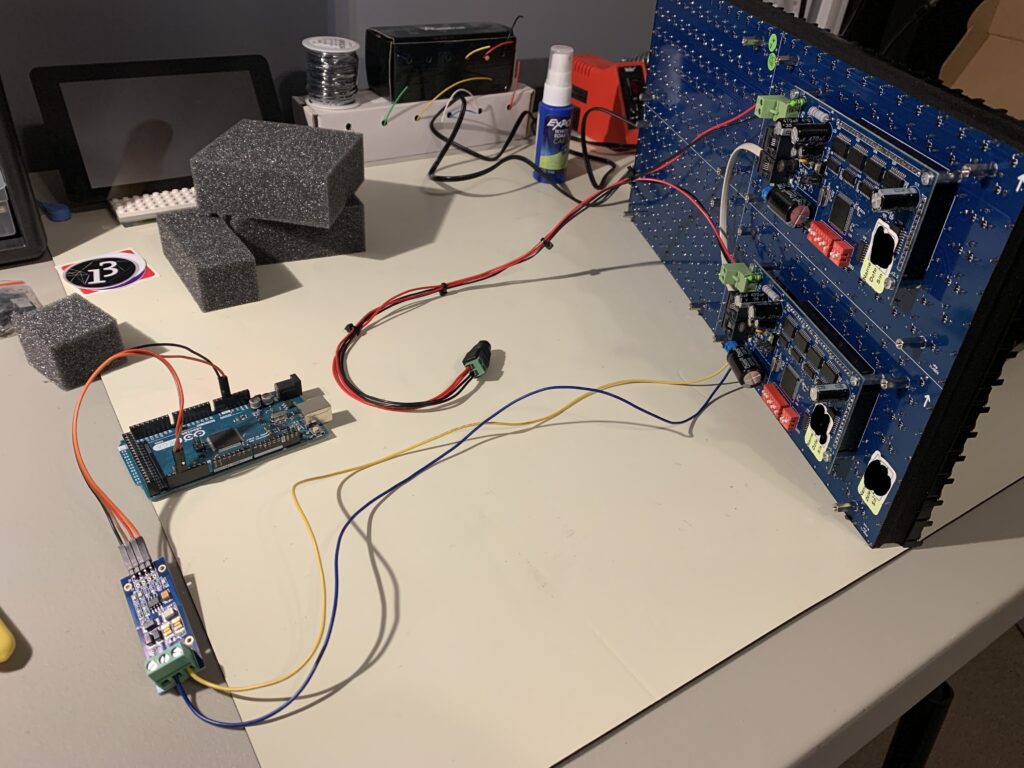
I saw flip dots (also called flip discs) last year for the first time and instantly knew I needed some in my life. If you’re not familiar with them, check out how they work!
The particular model I have is the ALFAZETA XY5, which may be the easiest way to get up and running, but certainly not the least expensive.
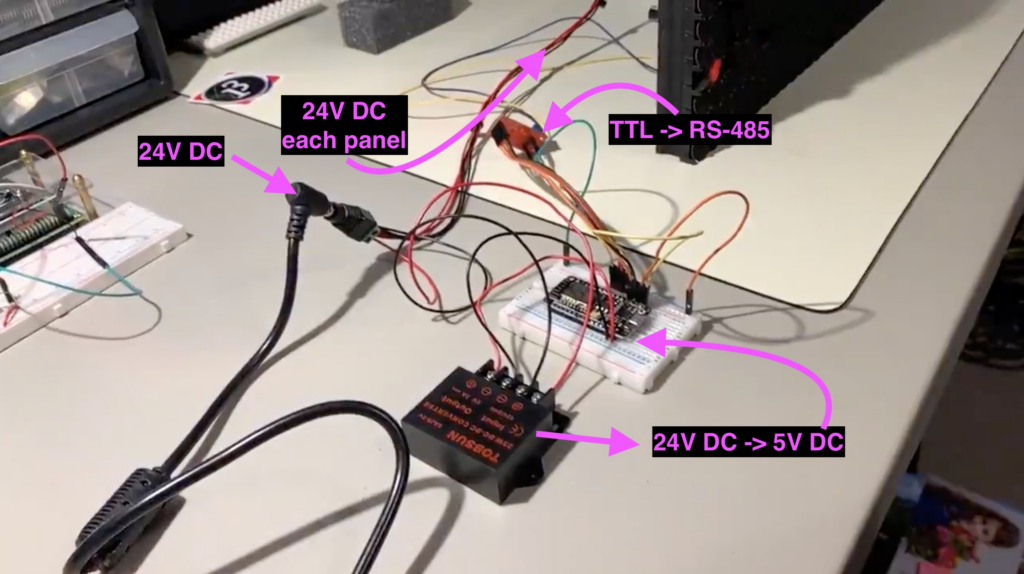
After getting the board, all you need is:
24V power supply
Something that talks over RS485 (in my case I used an ESP8266 connected to a MAX3485 board)
Their documentation that defines the controller data protocol
I plan to write in more detail how it all works, but for this demo the stack is:
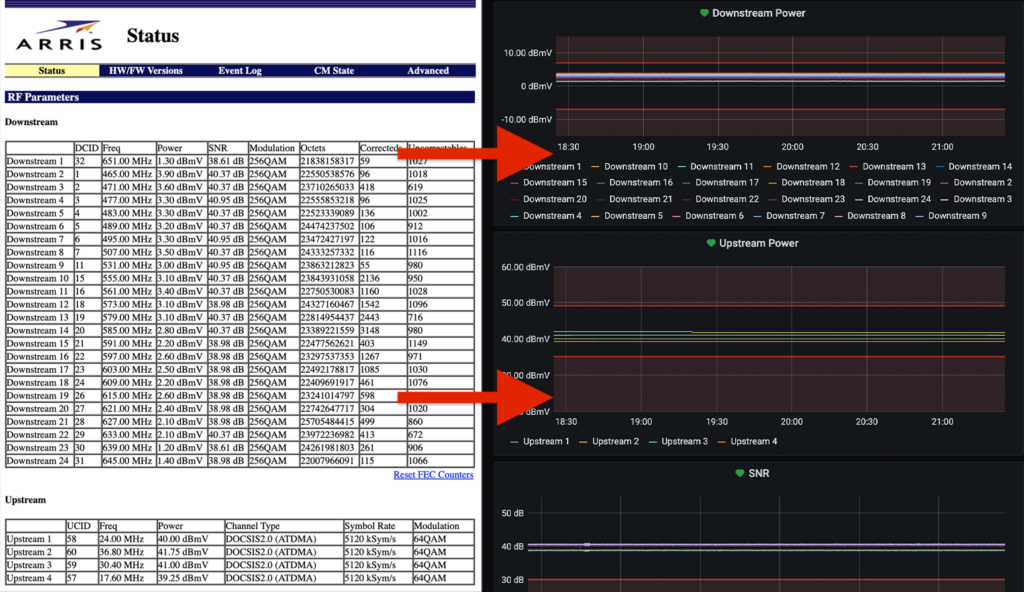
This project’s purpose is to start with a status page and end with Grafana graphs and alerts.
It felt good to complete this project that’s been on my list for quite some time. The main goal was to scrape the values from my modem’s status page and pipe them into InfluxDB, which feeds Grafana. Not only could I look at data trends, but I could receive alerts if certain values exceeded an acceptable threshold.
Overall this is a straightforward process:
Pull in the HTML from the status page (which happens to not need any authentication, making it even easier)
Parse the tables we care about (Downstream and Upstream) using XPaths
Munge the data into something suitable for InfluxDB
Insert the data into InfluxDB
Query the InfluxDB data from Grafana
I knew I wanted to use Python for the project, so I first looked into Scrapy. After wrapping my mind around it (somewhat) I gave it a go and actually had a working solution… but it felt way over engineered and at times inflexible for what I wanted. I threw 90% of that solution away and went with a simpler script.
What I landed on was something that’s custom and lightweight, but extendable in case someone has a different status page or wants to use an alternative to InfluxDB.
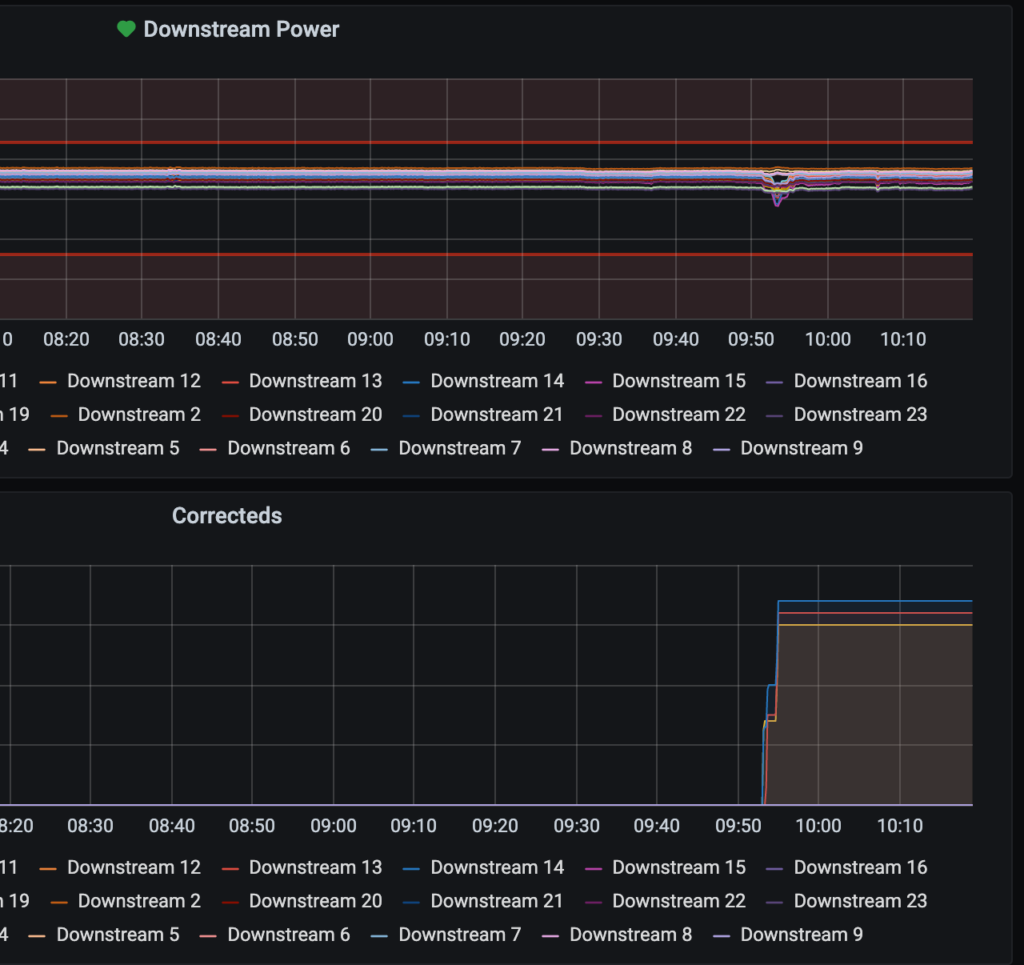
I’ve had it running for a day and I’m already seeing interesting data!
Every year Clemson plays USC for their state rivalry game. I pull for Clemson and my wife pulls for USC, so we’re what you call a “House Divided”. Since this game takes place on or after Thanksgiving, it’s a great time to incorporate the LED Christmas tree and troll my spouse!
The tree works like this:
When a team scores, it plays their fight song and lights up with their primary and secondary colors.
The lights on the tree are distributed by the ratio of points. When it’s tied, they each get 50% of the lights. If Team A has 2/3 more points, they get 2/3 more lights in their color.
The ring under the star at the top of the tree is the color of winning team. If they’re tied, it’s split.
When the game is finished, the tree is the color of the team that won.
Software
I used Golang for the software since I primarily write code in another language and want to get better at it. It makes use of various interfaces to aid in testing and abstration:
The Fetcher interface gets the latest game state from a data source
The Player interface plays audio at the given path
The Illuminator interface controls a light source (in this case the LED tree)
The source code for a local data fetcher is included in this repo only. The remote fetcher I built may or may not have used an API meant for this sort of consumption. It simply fetched from a remote data source, unmarshalled a JSON data structure, and supplied what the Fetcher interface needed.
The code runs on a Raspberry Pi and communicates with the MCU via serial. An iHome IBT63 speaker is used to play audio from the Raspberry Pi. I didn’t use the Bluetooth connection and instead used the shared power and audio connector, plugging one end into the RPi’s stereo jack and the other into the USB port.
I cross-compiled from my Mac using the rpi.sh script in the executable’s directory.
I was looking for a way to segment some IoT devices from my main network and disable their network connections on demand programmatically. The Guest Network feature on the router does a good job of segmenting the network, so I wanted a way to turn the guest network’s interface off and on based upon conditions.
Example scenario: You have cloud-based IoT cameras and want to cease all traffic when you’re home.
This puts toggling any interface on the router behind an HTTP endpoint. Since an interface is created when a guest network is enabled, we can now enable and disable that network whenever we want.